Review


c12 analogue  (ATCC)


Bioz Verified Symbol ATCC is a verified supplier
Bioz Manufacturer Symbol ATCC manufactures this product  
  • Logo
  • About
  • News
  • Press Release
  • Team
  • Advisors
  • Partners
  • Contact
  • Bioz Stars
  • Bioz vStars
  • 96

    Structured Review

    ATCC c12 analogue
    C12 Analogue, supplied by ATCC, used in various techniques. Bioz Stars score: 96/100, based on 388 PubMed citations. ZERO BIAS - scores, article reviews, protocol conditions and more
    https://www.bioz.com/result/c12 analogue/product/ATCC
    Average 96 stars, based on 388 article reviews
    c12 analogue - by Bioz Stars, 2026-05
    96/100 stars

    Images


    Similar Products

    96
    ATCC c12 analogue
    C12 Analogue, supplied by ATCC, used in various techniques. Bioz Stars score: 96/100, based on 1 PubMed citations. ZERO BIAS - scores, article reviews, protocol conditions and more
    https://www.bioz.com/result/c12 analogue/product/ATCC
    Average 96 stars, based on 1 article reviews
    c12 analogue - by Bioz Stars, 2026-05
    96/100 stars
      Buy from Supplier

    90
    Thermo Fisher c1-bodipy 500/510-c12 fluorescent fatty acid analogue #d3823
    C1 Bodipy 500/510 C12 Fluorescent Fatty Acid Analogue #D3823, supplied by Thermo Fisher, used in various techniques. Bioz Stars score: 90/100, based on 1 PubMed citations. ZERO BIAS - scores, article reviews, protocol conditions and more
    https://www.bioz.com/result/c1-bodipy 500/510-c12 fluorescent fatty acid analogue #d3823/product/Thermo Fisher
    Average 90 stars, based on 1 article reviews
    c1-bodipy 500/510-c12 fluorescent fatty acid analogue #d3823 - by Bioz Stars, 2026-05
    90/100 stars
      Buy from Supplier

    86
    Thermo Fisher long chain fatty acid analogue bodipy c12
    A) Schematic of fatty acid tracing in transwell using <t>BODIPY-FA,</t> a TEER electrode, and a pipet for sampling from the lower well. B) Accumulated fluorescence in the lower well after incubating transwell-plated hAMECs with increasing concentrations of BODIPY-FA. Each data point represents one well (n=4-5) with fitted linear regression line. C) 4 hrs BODIPY-FA accumulation in the lower compartment of transwells without cells or plated with hAMECs (left) or hCMECs (right) +/-cytochalasin B treatment. Data is displayed as % lower well accumulation compared to no cells (100%). Each datapoint represents wells (n=4-12) from separate experiments D) TEER measurements for hAMECs or hCMECs +/-cytochalasin B during tracer experiments. E) Confocal images of transwell membranes with hAMECs or hCMECs at the 4 hrs timepoint after Bodipy-FA (green) tracing, as indicated. Note the accumulation of clear lipid vesicles. Cells are co-stained with lectin (red), and nuclei with DAPI (blue) before imaging. Scale bar represents 50 µm. Quantification of lipid droplets per cell shown to the right.
    Long Chain Fatty Acid Analogue Bodipy C12, supplied by Thermo Fisher, used in various techniques. Bioz Stars score: 86/100, based on 1 PubMed citations. ZERO BIAS - scores, article reviews, protocol conditions and more
    https://www.bioz.com/result/long chain fatty acid analogue bodipy c12/product/Thermo Fisher
    Average 86 stars, based on 1 article reviews
    long chain fatty acid analogue bodipy c12 - by Bioz Stars, 2026-05
    86/100 stars
      Buy from Supplier

    99
    Thermo Fisher cholesterol chemical analogue cholesteryl bodipytm fl c12
    A) Schematic of fatty acid tracing in transwell using <t>BODIPY-FA,</t> a TEER electrode, and a pipet for sampling from the lower well. B) Accumulated fluorescence in the lower well after incubating transwell-plated hAMECs with increasing concentrations of BODIPY-FA. Each data point represents one well (n=4-5) with fitted linear regression line. C) 4 hrs BODIPY-FA accumulation in the lower compartment of transwells without cells or plated with hAMECs (left) or hCMECs (right) +/-cytochalasin B treatment. Data is displayed as % lower well accumulation compared to no cells (100%). Each datapoint represents wells (n=4-12) from separate experiments D) TEER measurements for hAMECs or hCMECs +/-cytochalasin B during tracer experiments. E) Confocal images of transwell membranes with hAMECs or hCMECs at the 4 hrs timepoint after Bodipy-FA (green) tracing, as indicated. Note the accumulation of clear lipid vesicles. Cells are co-stained with lectin (red), and nuclei with DAPI (blue) before imaging. Scale bar represents 50 µm. Quantification of lipid droplets per cell shown to the right.
    Cholesterol Chemical Analogue Cholesteryl Bodipytm Fl C12, supplied by Thermo Fisher, used in various techniques. Bioz Stars score: 99/100, based on 1 PubMed citations. ZERO BIAS - scores, article reviews, protocol conditions and more
    https://www.bioz.com/result/cholesterol chemical analogue cholesteryl bodipytm fl c12/product/Thermo Fisher
    Average 99 stars, based on 1 article reviews
    cholesterol chemical analogue cholesteryl bodipytm fl c12 - by Bioz Stars, 2026-05
    99/100 stars
      Buy from Supplier

    90
    Thermo Fisher fluorescent fatty acid analogue c1-bodipy-c12
    A) Schematic of fatty acid tracing in transwell using <t>BODIPY-FA,</t> a TEER electrode, and a pipet for sampling from the lower well. B) Accumulated fluorescence in the lower well after incubating transwell-plated hAMECs with increasing concentrations of BODIPY-FA. Each data point represents one well (n=4-5) with fitted linear regression line. C) 4 hrs BODIPY-FA accumulation in the lower compartment of transwells without cells or plated with hAMECs (left) or hCMECs (right) +/-cytochalasin B treatment. Data is displayed as % lower well accumulation compared to no cells (100%). Each datapoint represents wells (n=4-12) from separate experiments D) TEER measurements for hAMECs or hCMECs +/-cytochalasin B during tracer experiments. E) Confocal images of transwell membranes with hAMECs or hCMECs at the 4 hrs timepoint after Bodipy-FA (green) tracing, as indicated. Note the accumulation of clear lipid vesicles. Cells are co-stained with lectin (red), and nuclei with DAPI (blue) before imaging. Scale bar represents 50 µm. Quantification of lipid droplets per cell shown to the right.
    Fluorescent Fatty Acid Analogue C1 Bodipy C12, supplied by Thermo Fisher, used in various techniques. Bioz Stars score: 90/100, based on 1 PubMed citations. ZERO BIAS - scores, article reviews, protocol conditions and more
    https://www.bioz.com/result/fluorescent fatty acid analogue c1-bodipy-c12/product/Thermo Fisher
    Average 90 stars, based on 1 article reviews
    fluorescent fatty acid analogue c1-bodipy-c12 - by Bioz Stars, 2026-05
    90/100 stars
      Buy from Supplier

    Image Search Results


    A) Schematic of fatty acid tracing in transwell using BODIPY-FA, a TEER electrode, and a pipet for sampling from the lower well. B) Accumulated fluorescence in the lower well after incubating transwell-plated hAMECs with increasing concentrations of BODIPY-FA. Each data point represents one well (n=4-5) with fitted linear regression line. C) 4 hrs BODIPY-FA accumulation in the lower compartment of transwells without cells or plated with hAMECs (left) or hCMECs (right) +/-cytochalasin B treatment. Data is displayed as % lower well accumulation compared to no cells (100%). Each datapoint represents wells (n=4-12) from separate experiments D) TEER measurements for hAMECs or hCMECs +/-cytochalasin B during tracer experiments. E) Confocal images of transwell membranes with hAMECs or hCMECs at the 4 hrs timepoint after Bodipy-FA (green) tracing, as indicated. Note the accumulation of clear lipid vesicles. Cells are co-stained with lectin (red), and nuclei with DAPI (blue) before imaging. Scale bar represents 50 µm. Quantification of lipid droplets per cell shown to the right.

    Journal: bioRxiv

    Article Title: Adipose tissue microvascular endothelial cells form a tight vascular barrier that selectively transcytoses fatty acid tracers

    doi: 10.1101/2024.03.19.585709

    Figure Lengend Snippet: A) Schematic of fatty acid tracing in transwell using BODIPY-FA, a TEER electrode, and a pipet for sampling from the lower well. B) Accumulated fluorescence in the lower well after incubating transwell-plated hAMECs with increasing concentrations of BODIPY-FA. Each data point represents one well (n=4-5) with fitted linear regression line. C) 4 hrs BODIPY-FA accumulation in the lower compartment of transwells without cells or plated with hAMECs (left) or hCMECs (right) +/-cytochalasin B treatment. Data is displayed as % lower well accumulation compared to no cells (100%). Each datapoint represents wells (n=4-12) from separate experiments D) TEER measurements for hAMECs or hCMECs +/-cytochalasin B during tracer experiments. E) Confocal images of transwell membranes with hAMECs or hCMECs at the 4 hrs timepoint after Bodipy-FA (green) tracing, as indicated. Note the accumulation of clear lipid vesicles. Cells are co-stained with lectin (red), and nuclei with DAPI (blue) before imaging. Scale bar represents 50 µm. Quantification of lipid droplets per cell shown to the right.

    Article Snippet: A dual system was developed to trace both 0,57 mg/mL FITC-Dextran and 2 μM of the long-chain fatty acid analogue BODIPY-C12 (558/568) (ThermoFisher, cat. #D3835) in one well.

    Techniques: Sampling, Fluorescence, Staining, Imaging

    A) Schematic of an EC-plated transwell incubated with both the BODIPY-FA and FITC-dextran tracers, followed by fluorescent reading at 544/590 nm (red BODIPY-FA fluorescence) and 488/520 nm (green dextran fluorescence) using a plate reader. B) Schematic of the analysis, normalizing the level of selective transport over the EC monolayer to that of the maximal versus free diffusion of the tracers to the lower wells in transwells without cells. C) Measurements of both dyes while increasing the concentration of FITC-Dextran in a solution of 2 μM BODIPY-FA (left) or increasing BODIPY-FA concentrations in the presence of 4 mg/ml FITC-Dextran (right) with fitted linear regression lines. D) Tracer-specific accumulation of FITC-Dextran and BODIPY-FA in the lower well for hAMECs and hCMECs over time. Datapoints represent the average of 4 wells per experiment (n=3-4 experiments), E) Transport of different substrates (Dextran 40kDa, Dextran 250kDa, BODIPY-FA, and the glucose tracer NBDG) by hAMECs, showing substrate-preference for BODIPY-FA. Each datapoint represents one well (n=4-9) from experiments. F) Fatty acid to dextran transport ratio for hAMECs compared to other primary ECs -/+ cytochalasin B treatment. All data is represented as mean ± SEM from seperate experiments.

    Journal: bioRxiv

    Article Title: Adipose tissue microvascular endothelial cells form a tight vascular barrier that selectively transcytoses fatty acid tracers

    doi: 10.1101/2024.03.19.585709

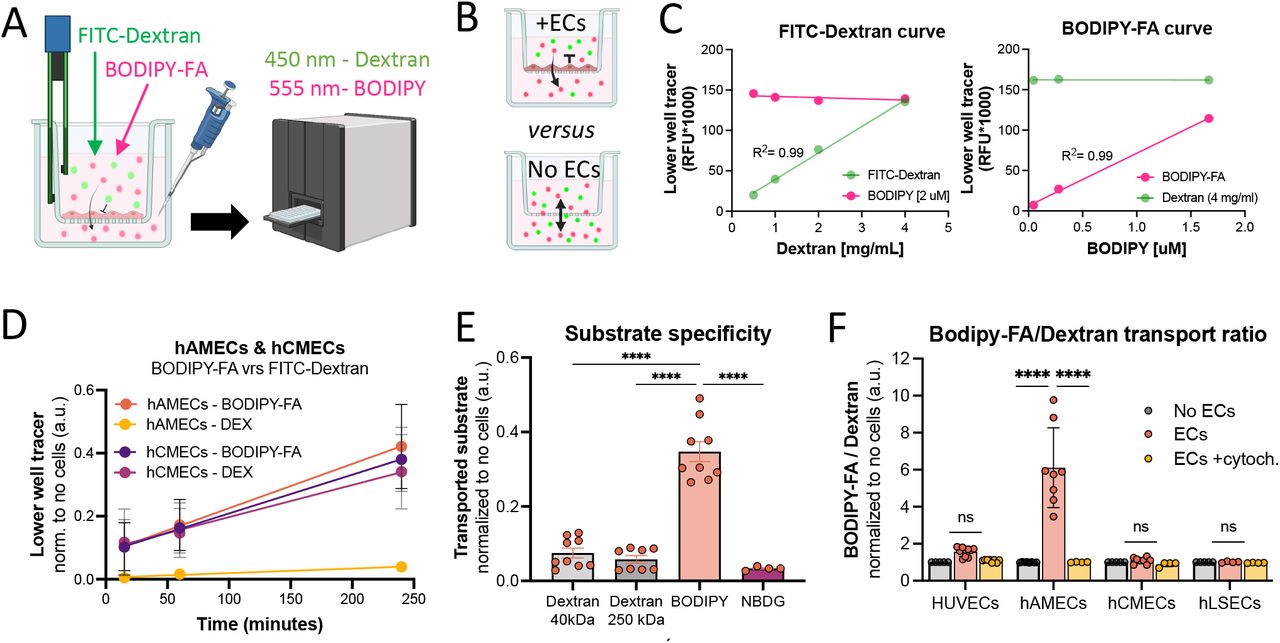
    Figure Lengend Snippet: A) Schematic of an EC-plated transwell incubated with both the BODIPY-FA and FITC-dextran tracers, followed by fluorescent reading at 544/590 nm (red BODIPY-FA fluorescence) and 488/520 nm (green dextran fluorescence) using a plate reader. B) Schematic of the analysis, normalizing the level of selective transport over the EC monolayer to that of the maximal versus free diffusion of the tracers to the lower wells in transwells without cells. C) Measurements of both dyes while increasing the concentration of FITC-Dextran in a solution of 2 μM BODIPY-FA (left) or increasing BODIPY-FA concentrations in the presence of 4 mg/ml FITC-Dextran (right) with fitted linear regression lines. D) Tracer-specific accumulation of FITC-Dextran and BODIPY-FA in the lower well for hAMECs and hCMECs over time. Datapoints represent the average of 4 wells per experiment (n=3-4 experiments), E) Transport of different substrates (Dextran 40kDa, Dextran 250kDa, BODIPY-FA, and the glucose tracer NBDG) by hAMECs, showing substrate-preference for BODIPY-FA. Each datapoint represents one well (n=4-9) from experiments. F) Fatty acid to dextran transport ratio for hAMECs compared to other primary ECs -/+ cytochalasin B treatment. All data is represented as mean ± SEM from seperate experiments.

    Article Snippet: A dual system was developed to trace both 0,57 mg/mL FITC-Dextran and 2 μM of the long-chain fatty acid analogue BODIPY-C12 (558/568) (ThermoFisher, cat. #D3835) in one well.

    Techniques: Incubation, Fluorescence, Diffusion-based Assay, Concentration Assay

    A) Ratio of BODIPY-FA to FITC-dextran accumulation in the lower well of hAMECs (left) and hCMECs (right) after 1 hr incubation with tracers and endocytosis inhibitors targeting different pathways: vehicle (0,1% DMSO), 50µM Dynasore, 200 µM Genistein, 20 µM PitStop2 or 100 µM Amiloride. Each data point represents one well from 2 experiments. B) TEER representing barrier integrity 4 hours after endocytosis inhibitor treatments. Each data point represents one well (n=4-8) from a 1-2 experiments. Data represented as normalized to vehicle ± SEM.

    Journal: bioRxiv

    Article Title: Adipose tissue microvascular endothelial cells form a tight vascular barrier that selectively transcytoses fatty acid tracers

    doi: 10.1101/2024.03.19.585709

    Figure Lengend Snippet: A) Ratio of BODIPY-FA to FITC-dextran accumulation in the lower well of hAMECs (left) and hCMECs (right) after 1 hr incubation with tracers and endocytosis inhibitors targeting different pathways: vehicle (0,1% DMSO), 50µM Dynasore, 200 µM Genistein, 20 µM PitStop2 or 100 µM Amiloride. Each data point represents one well from 2 experiments. B) TEER representing barrier integrity 4 hours after endocytosis inhibitor treatments. Each data point represents one well (n=4-8) from a 1-2 experiments. Data represented as normalized to vehicle ± SEM.

    Article Snippet: A dual system was developed to trace both 0,57 mg/mL FITC-Dextran and 2 μM of the long-chain fatty acid analogue BODIPY-C12 (558/568) (ThermoFisher, cat. #D3835) in one well.

    Techniques: Incubation